
Week 2
The Snowball (or Slushball) Earth concept was investigated using video and the BBC Horizon programme. The feedbacks that caused this to occur were discussed and an online whiteboard was produced to show understanding of the positive mechanisms that led to this. The conceptboard showing this can be found here.
Our knowledge of past climate change has come from a variety of sources, which is how we know (or can give a good guess) to what climatic conditions were throughout history. These climate change records are not as precise as the measurements taken today, but paleoclimatogists can infer conditions from these proxy records.

These records can be taken from sources such as trees and ice. Dendrochronology, the science of tree rings, can infer the weather conditions in a given year, based on how much the tree grew during that year. In a cold and wet year a tree would typically produce less growth than during a warm one.
Ice cores are also used as a proxy for measuring climate. Similar to the tree rings, they develop in layers during winter and summer seasons, so a yearly increment of precipitation can be determined. In addition ice locks in greenhouse gases and dust. The isotopes of the gases can suggest the conditions at the time. For example, in polar ice cores, like the one at Vostok less heavy oxygen in the frozen water means that temperatures were cooler. Other information that can be gathered is the amount of dust- the more dust in the core sample, the more desertification is occurring. Even the amount of other elements could suggest changes, e.g. increased levels of sulphur could be a sign of more volcanic activity.
Ice cores are also used as a proxy for measuring climate. Similar to the tree rings, they develop in layers during winter and summer seasons, so a yearly increment of precipitation can be determined. In addition ice locks in greenhouse gases and dust. The isotopes of the gases can suggest the conditions at the time. For example, in polar ice cores, like the one at Vostok less heavy oxygen in the frozen water means that temperatures were cooler. Other information that can be gathered is the amount of dust- the more dust in the core sample, the more desertification is occurring. Even the amount of other elements could suggest changes, e.g. increased levels of sulphur could be a sign of more volcanic activity.
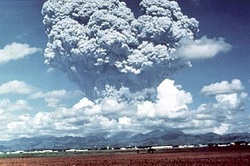
Volcanic activity, such as the eruption of Mount Pinatubo in 1991, release enormous amounts of dust in to the atmosphere. These aerosols are spread around the world by air currents and change the albedo of the atmosphere, reflecting more of the solar radiation back to space. This then leads to the Earth’s temperature decreasing.
Despite the impact of natural processes, such as volcanic activity, the current rapid climate change can be attributed to anthropogenic sources. “As the Earth moved out of ice ages over the past million years, the global temperature rose a total of 4 to 7 degrees Celsius over about 5,000 years. In the past century alone, the temperature has climbed 0.7 degrees Celsius, roughly ten times faster than the average rate of ice-age-recovery warming” (NASA 2014).
Despite the impact of natural processes, such as volcanic activity, the current rapid climate change can be attributed to anthropogenic sources. “As the Earth moved out of ice ages over the past million years, the global temperature rose a total of 4 to 7 degrees Celsius over about 5,000 years. In the past century alone, the temperature has climbed 0.7 degrees Celsius, roughly ten times faster than the average rate of ice-age-recovery warming” (NASA 2014).

The main themes that were covered included the idea that climate change can be driven by either or both natural and anthropogenic reasons. Natural causes include greenhouse gases and their presence in the atmosphere or the lithosphere. This difficult concept was made easier by a series of videos, but it’s still a complex idea.
Proxy measurements of temperature and other climatic conditions- using tree rings, ice cores and pollen as fossils- are very interesting. Pollen, for example, is quickly covered in mud and preserve more readily than large animals. As different plants have different shaped pollen the fossil can usually be identified to species level. Unfortunately, this does not work for all plants; grasses have the same pollen shape, so cannot be identified any further than the graminaceae family.
As plants are adapted to different weather and climate conditions, the presence of species in a fossil record can indicate the climate at the time when the pollen was produced (British Society of Geomorphology, 2012).
